昨年の数か月間、イリノイ大学アーバナ シャンペーン校の物理学者である Nigel Goldenfeld と Sergei Maslov のペアは、州の COVID-19 パンデミック対応において有名人とは思えませんでした。>
彼らの典型的な研究分野には、疫学や公衆衛生ではなく、凝縮物質の物理学、ウイルスの進化、人口動態のモデルの構築が含まれます。しかし、さまざまな分野の多くの科学者と同様に、彼らは 3 月に COVID-19 モデリングの取り組みに参加しました。そのとき、米国での対応は、実際の国家の指示や確立されたテスト プロトコルがない中で、「総力戦」の活動の旋風でした。国の指導者から地方の役人に至るまで、誰もが噴火するパンデミックに対処するのに役立つモデルを求めていました.それがどれほど悪化するか、どれくらい速くなるか、そしてそれを回避するために何をすべきかを正確に伝えることができる何かを望んでいました.
2020 年の初めの数か月間、ゴールデンフェルドとマスロフは、COVID-19 のモデリング作業に対して肯定的な報道を浴びせられました。彼らのモデルは、大学が春にキャンパスを迅速に閉鎖し、オンラインのみの教育に移行するよう促すのに役立ちました。その後まもなく、彼らは、イリノイ州知事のオフィスに結果を報告するために採用されたいくつかのモデリング グループの 1 つになりました。
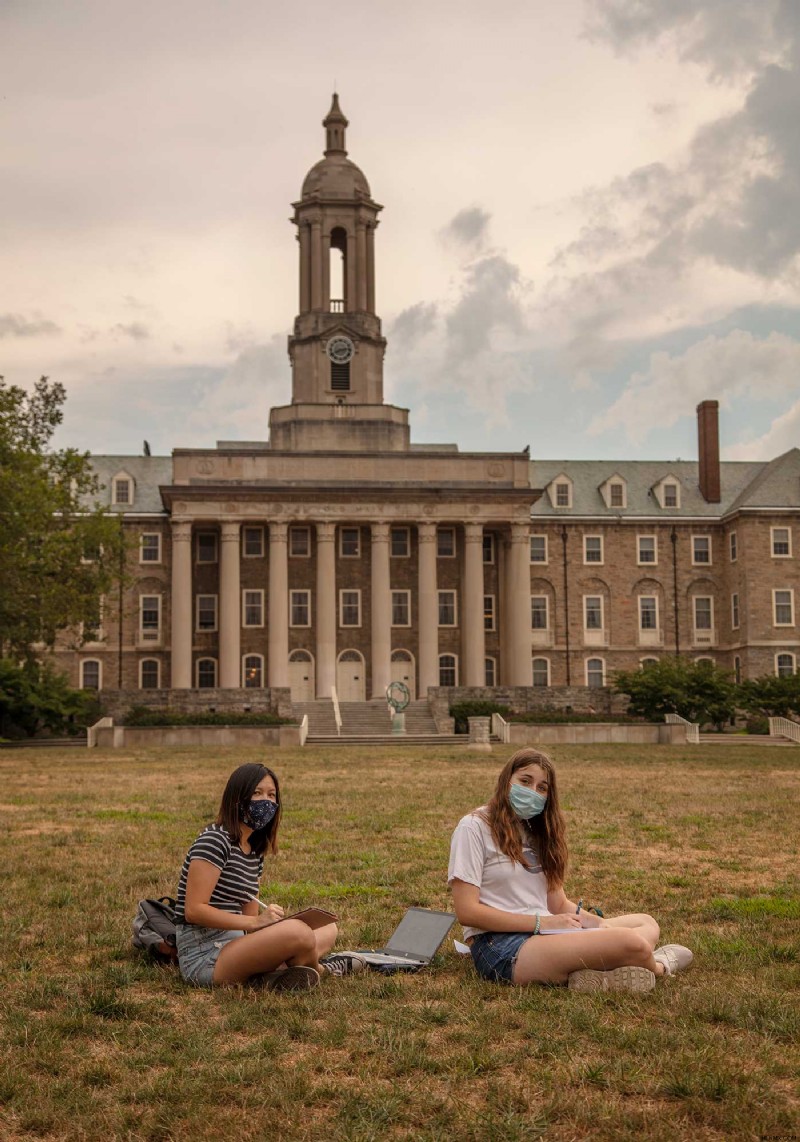
そのため、Goldenfeld 氏、Maslov 氏、およびその他の研究チームが、大学の再開プロセスを導く新しいモデルを構築したとき、そのモデルに対する信頼は高まりました。彼らは、さまざまな場所で学生が交流するさまざまな方法 (勉強、食事、リラックス、パーティーなど) を考慮していました。彼らは、キャンパス内のテストと隔離サービスがどれだけうまく機能するかを見積もっていました。彼らは、ウイルスが蔓延している間、生徒の何パーセントが症状を示さない可能性があるかを考慮していました.これらすべての要因とそれ以上のものについて、彼らは広範囲の潜在的な不確実性と仮説シナリオに対して緩衝していました.彼らは、エアロゾル拡散の物理学を表すことにより、ほとんどの学校再開モデルにはない追加の詳細レイヤーを構築しました。教室でマスクを通して話しているとき、または飲んで叫んでいるときに学生が放出するウイルス粒子の数です。混雑したバーでの音楽。
モデルのガイダンスに従って、イリノイ大学は計画を策定しました。週に 2 回、すべての生徒にコロナウイルスの検査を行い、マスクの使用を義務付け、効果的な接触者追跡システムや接触を通知する電話アプリなど、その他のロジスティクス上の考慮事項と制御を実装します。計算によると、このポリシーの組み合わせは、ウイルスの指数関数的な拡散に影響を与えることなく、対面での指導を再開するのに十分であることが示唆されました.
しかし、秋学期が始まってわずか 1 週間後の 9 月 3 日、大学は暗い現実に直面しました。その学生の約 800 人がコロナウイルスの検査で陽性でした。これは、モデルが感謝祭までに予測したよりも多くの結果でした。管理者は、キャンパス全体で不要な活動を直ちに停止する必要がありました。
何がうまくいかなかったのですか?科学者たちは、間違いの余地が非常に多く、学生がどのように行動するかについて非常に多くの偶然性を含んでいるように見えました. 「私たちが予想していなかったのは、彼らが法律を破るということでした」とゴールデンフェルド氏は言いました。一部の学生は、検査で陽性となり、隔離するように言われた後でも、とにかくパーティーに出席する.これは非常に重要であることが判明しました。COVID-19 がどのように広がるかを考えると、たとえ少数の学生が規則に違反したとしても、感染率が爆発する可能性があります。
批評家はゴールデンフェルドとマスロフをすぐに攻撃し、彼らが傲慢であり、彼らの路線にとどまらなかったと非難しました。 .
一方、イリノイ大学は決してユニークではありませんでした。全国の多くの大学は、彼ら自身のモデルが言っていることと実際に起こったこととの間の同様の相違を考慮することを余儀なくされました — 相違は後に、さまざまな理由の組み合わせに起因するものでした.
このような出来事は、厳しい現実を浮き彫りにしました。疫学モデルは非常に有用で重要ですが、不完全なツールであり、使用するデータとその根拠となる仮定に敏感です。また、その繊細さのために、その意図された目的と使用法が誤解されることがよくあります。
これらのモデルを開発する研究者は、計り知れないほど困難な地形をナビゲートし、多くの場合、答えがない場合でも、保証できない確実性で答えを提供する必要があります。彼らは、完全には理解されていないウイルスの生物学だけでなく、さらに滑りやすくとらえどころのない人間の行動についても仮定を立てなければなりません。そして、精度を犠牲にすることなく、数週間または数か月の価値のある分析を数日で詰め込み、ワープスピードですべてを実行する必要があります.その間ずっと、彼らは長い時間、眠れない夜、そして科学者、コミュニケーター、擁護者、アドバイザーとしての個人的な犠牲に苦しんでいます. (彼らの通常の責任は言うまでもなく、危機によって何倍にも拡大されました。これらの科学者の多くとの通話では、乳児の泣き声、犬の吠え声、またはバックグラウンドでの他の活動の不協和音を聞く可能性が高いです。)
コロラド大学ボルダー校の計算生物学者であるダニエル・ラレモア氏は、「今は本当に疲れています」と語った. 「明確な最善の解決策はなく、人々は病気になります。そして、同僚の 1 人が本当に病気になったり、誰かが亡くなったりした場合、どのように感じるのだろうかと思っています。」彼と同じ立場にある他の人々がツイッターでその疲労を告白した後、誰かが、これらの賭けは国家安全保障と防衛の分野で働く人々にとって新しいことではないと反論したことを覚えています.それらの中で最も耐え難いものを探す必要があります.
「あなたは与えられたもので最善を尽くしますが、私にはわかりません」と彼は言いました。 「私は毎日入ってくる数字を見て、何を見逃しているのだろうと思っています。」
COVID-19 によってもたらされた世界的な健康危機において、疫学的モデリングは、科学者、意思決定者、一般の人々にとって前例のない役割を果たしてきました。ほんの 1 年ほど前まで、「再生産数」や「シリアル間隔」などの用語は、一般の人にとってはありふれた言葉ではありませんでした。ノースイースタン大学のネットワーク科学者兼疫学者であるサミュエル・スカルピーノ氏は、科学界においてさえ、感染症モデリングは「かなりニッチな研究分野」であると述べています。
過去1年間、モデルは新しいコロナウイルスの内部の仕組みとそれがどのように広がるかへの窓を開きました.彼らは、無数の設定で特定の瞬間に病気の影響を示す焦点を絞ったスナップショットを提供し、それらの状況が今後どのように変化する可能性があるかを示唆しています.彼らは、社会の一部を閉鎖し、再び開放するための決定と政策を導きました.
同時に、科学者はツールとしてのモデルの限界を考慮しなければなりませんでした。また、パンデミックがモデルの有用性を限界点まで押し上げる可能性があることを認識しなければなりませんでした。社会に対する病気の被害は、偏りのない一貫した患者データを取得することに伴う頭痛の種を増大させ、モデルが反映する必要がある人間の行動の気まぐれさと不合理さを増幅します。おそらく最大の課題は、意思決定者がモデルが何を言っていて何を言っていないか、そして彼らの答えがどれほど不確実であるかを完全に理解することです.
しかし、これらの課題は大きな改善の原動力にもなっています。テキサス大学オースティン校の数理生物学者である Lauren Ancel Meyers は、疫学モデリングの世界では「多くの新しい考え方、新しい方法」が見られると述べています。 「過去 [10] か月間で、過去 6 年間と同じくらい進歩したと思います。」
パンデミックの診断
感染症の専門家が 2019 年 12 月下旬から 2020 年 1 月上旬にかけて、中国で肺炎に似た病気のクラスターが発生したと聞き始めたとき、彼らはすぐに用心深くなりました。ロンドン衛生熱帯医学大学院の疫学者であるアダム・クチャースキー氏は、「私たちの分野では、パンデミックは常に脅威として注目されています」と述べています。実際、H1N1 インフルエンザ、SARS、MERS、エボラの 4 つの流行は、過去 20 年間だけでも急増し、新しい感染因子は絶えず進化しています。
しかし、中国でコロナウイルスが発生した初期の頃は、多くの病気がそうであるように、それが脅威に発展するのか、すぐに消えるのかを予測するのに十分な知識はありませんでした.ウイルスは人から人へ感染したのか、それともすべての感染が武漢の 1 つの市場で同じ動物から発生したのか?国境を閉鎖することで感染を封じ込めることができるのでしょうか、それとも世界的に広がるのでしょうか?
事実上データが手元になく、ウイルスが何をしているのか、どのように機能するかについての実際の概念もまだないため、研究者は答えを求めてモデルに目を向けました.
香港大学の感染症および公衆衛生チームのメンバーである数学的疾患モデラーのジョセフ・ウーは、武漢とその周辺で報告されている症例数を注意深く調べていました。人から人への感染の可能性が非常に高いように見え始めました。最初はタイで、次に日本で、少数の症例が中国の国境を越えて発生しました。報告された広がりと中国から他の国への旅行量に基づいて、ウー氏と彼の同僚は、「武漢での感染者数は、当時発表されたものよりもはるかに多いに違いない」と推測した.アウトブレイクのサイズが大幅に大きい場合は、人々がウイルスを他の人に移していることを意味します.
このような結論に達したのは、ウーと彼のチームだけではありません。 2020 年 1 月 10 日、世界保健機関は、同様の分析を行っている世界中の専門家チームのために電話会議を主催し、独自の疾患モデルをまとめ、同じ懸念を表明しました。

それでも、香港のグループは、状況をよりよく把握するために、より多くのデータを求めていました。 2020 年 1 月 23 日、ウーと彼の同僚は北京行きの飛行機に乗り込み、中国疾病管理予防センターのメンバーと会う予定でした。
彼らは危機が頭に浮かんだのと同じようにそれを成し遂げました:彼らが空中にいる間、武漢は公式の封鎖に入りました. (彼らは飛行機が着陸した後に初めてニュースを知りました。)過去3週間をデータ収集に費やした中国CDCの研究者と協力して数日間の多忙な日々を過ごした後、香港の代表団は、武漢での発生は次の順序であったに違いないと結論付けましたその時点で公式に報告されていた数千ではなく、数万のケースです。 「私たちがデータを見る前から彼らが街を封鎖していたことを考えると、私たちはすでに知っていました」とウーは言いました。
さらに懸念されるのは、これらの数字とその後の分析は、ウイルスが急速に広がる可能性があるだけでなく、大部分の症例が検出されず、亀裂をすり抜けて別の場所で流行をまき散らしていることを示唆していたことです.人々が症状を示し始める前でさえ、感染の多くは起こっていました。これはパンデミックであると断言する時が来ました — 迅速であるだけでなく、少なくとも部分的には静かなものでした.
「ほとんどが武漢だけだった1月末までさかのぼることを想像してみてください」とウー氏は語った。 「私たちがそのような発言をするとき、いくらかのプレッシャーがあります。もし私たちが間違っていたらどうしますか?」不必要に世界的なパニックを引き起こしている可能性があります。さらに悪いことに、疫学モデルが将来どのように受け入れられるかを損なう可能性があり、今後数年間でさらに多くの公衆衛生上の危機を引き起こす可能性があります.最終的に、彼らはリスクが十分に大きいと判断し、「予測に不確実性があることを知っていても、前進して世界に警告する必要があります」と彼は言いました.
「もちろん、研究者として貢献したいと思っています」と彼は付け加えた。 「しかし同時に、私はそのような責任を負うことに慣れていません。」
入手不可能な数字
世界中で、他の疫学的モデル作成者も、これらの新しい責任に苦労していました。無症候性の広がりのレベルは、受け入れてモデル化することが特に困難でした。通常、呼吸器感染症はくしゃみや咳、つまり感染症の症状を介して感染します。 SARS-CoV-2 はより密かに移動しました。カリフォルニア大学バークレー校の生物統計学者であるニコラス・ジュエルは、「無症候性感染率が非常に高い他の例を実際に見つけるのに苦労しています」と述べています。
最初は、COVID-19 を説明するためのパラメーターがどうあるべきかについてほとんど知識がなかったため、研究者は次善の策である SARS (コロナウイルスによって引き起こされる別の伝染病) の数値をモデルに入力しました。しかし、SARS の特性を使用して新型コロナウイルスの感染力学を表すと、この 2 つは非常に大きく異なることがわかりました。
Meyers は、これを試みた科学者の 1 人です。彼女のチームのモデルでは、中国から得られた最初の数字でさえ、「当時は驚くべき 3 つの重要な点を指摘していました」と彼女は言いました。 1つは、ウーのチームが見たように、病気がSARSの約2倍の速さで広がっていたことです。その拡散の大部分は、人々が症状を発症する前に明らかに起こっていました.また、最初に症状を感じてから 2 週間感染力が持続する人もいるようでした。つまり、病人や感染していると思われる人は、長期間隔離する必要があります。
マイヤーズが 2 月に米国疾病管理予防センターなどにこの発見について電子メールを送ったとき、 特に、発症前および無症候性感染の潜在的なレベルについて。 「誰もが基本的に『ああ、あなたは間違っているに違いない』と言っていました。しかし、その後 — 数日以内に言いたいのですが — 突然、このすべてのデータが中国から衝突してきました。 、これは本当に、本当に悪いです。このことは、私たちが制御できないパンデミックの素因を持っています.」
一方、他の専門家は、さらなる挑戦の前兆を見ていました.
London School of Hygiene and Tropical Medicine の感染症モデラーである Sam Abbott は、2019 年の秋に博士号を取得し、2020 年 1 月 6 日に新しい研究の仕事を開始したばかりで、リアルタイムの発生分析のための統計手法を開発していました。彼の最初のプロジェクトは、イエメンでのコレラの発生に焦点を当てることになっていたのですが、わずか 6 日後、彼は自分が COVID-19 に取り組んでいることに気付きました。
アボットは、特定の統計手法を使用して、病気の伝染を支配する要因を推定することに慣れていました。しかし、彼と彼の同僚は、次第に厄介な認識に至りました。COVID-19 の無症候性および発症前感染の蓄積された証拠は、これらの技術が常に機能するとは限らないことを意味していました。たとえば、病気の有効再生産数は、アウトブレイク中の特定の時間に 1 つのケースから感染した個人の平均数です (時間の経過とともに、この数は変化する可能性があります)。しかし、感染例の多くが事実上目に見えない場合、研究者は、再生産数を推測する方法が信頼できなくなることを発見しました.
「それは非常に微妙な問題です」と、アボットは言いました。 「それについて考えるだけで、人々が互いにグラフを送信するのに時間がかかりました。」ただし、この発見の意味するところは、少なくとも一部の状況では、研究者は必要な変数を見つけ出し、有用なモデルを構築するためのまったく新しいアプローチが必要になるということでした.
それでも、モデルが不完全でデータが不完全であっても、SARS-CoV-2 が急速に国境を越え、拡散が制御不能になっていることは明らかでした。 2月にワシントン州のナーシングホームでこの病気が猛威を振るい、米国での危機が始まったとき、「それは、私たちがやっていることをすべてやめなければならないことを知った瞬間でした」とケイトリン・ゴスティックは言いました. 、疫学的問題を研究するシカゴ大学の生態学のポスドク研究者。旅行者をスクリーニングしても、このウイルスに対してはまったく効果がないことが判明しました。このウイルスは突然どこにでもあるように見えたため、科学者は「私たちの目の前で火を消そうとしているだけです」と Laremore 氏は述べています。
2020 年 3 月に、COVID-19 をパンデミックと公式に宣言したのは WHO でした。モデリング作業は、その最初の重要な役割の 1 つを果たしていました。つまり、脅威が存在することを確立し、その性質について詳細を記入することです。
そして、それが起こると、何百万人もの命が失われる可能性があるため、政策立案者と一般の人々は、これらのモデルからより多くの答えを求め始めました.少なくとも人々が必死に望んでいた形ではありません.
水晶玉ではありません
疫学モデルは未来についての声明を出すので、それを天気予報に例えたくなりますが、それは深刻な誤りでもあります。モデルを扱う科学者がすぐに強調するように、この 2 つを比較することはできません。しかし、彼らが同様の種類の予測を行うことができるという誤った信念は、モデリングの「失敗」に対する世間の緊張の中心にあることがよくあります.
天気予報の質は、何千もの気象学的不確実性にもかかわらず、明日嵐が来るかどうか (そして嵐がどれくらい続くか、どれくらい雨が降るか) をどれだけ正確かつ確実に予測するかにかかっています。しかし、気象学者がハリケーンの進路を予測する場合、その地域の人々が避難するかその場にとどまるかの決定は、ハリケーンがどこに行くか、またはハリケーンの強さに影響を与えません。
対照的に、人々の行動は病気の伝染に直接的な影響を与えます。人々が脅威にどのように対応するかについてのさらなる不確実性は、人間の行動、モデル化の結果、アウトブレイクのダイナミクスの間のフィードバック ループを複雑にします。
疫学だけでなく、物理学、生態学、気候学、経済学、その他すべての分野の科学者が、未来のオラクルとしてモデルを構築しないのはそのためです。彼らにとって、モデルは「特定のプロセスや関心のある特定の質問を理解するための単なる方法であり、仮定の論理的な意味を検討するためのものです」と Kucharski 氏は述べています。多くの疫学研究者は、病気とその伝染について有用な洞察を得ることは、モデリングの最も重要な目的であると考えています。
ゴールデンフェルドは、イリノイ大学の彼のグループの再開作業に投げかけられた軽蔑の一部は、モデルに対する大衆の誤解を非難している. 「私たちのモデルの目的は、[特定の介入] が機能するかどうかを確認することでした。 2020 年 11 月 17 日に 234 人の感染者が出るとは予測できませんでした」と彼は言いました。 「ポイントは、トレンドとは何か、これから得られる定性的なテイクホーム メッセージとは何かを理解することです。それが合理的に期待できる唯一のことです。」
しかし、特にモデルの出力が一見正確に聞こえる数値である場合、その区別は簡単に失われる可能性があります。
基本的に、すべてのモデルは単純化された (必ずしも単純である必要はありませんが) システムの表現です。彼らは、ウイルスの潜伏期間の長さ、人々が感染している期間、すべてのケースで発生した死亡者数など、そのシステムの特定の測定可能な機能を入力として取得します。モデルのアルゴリズムは、これらの入力を相互に関連付けたり、他の要因に関連付けたり、適切に操作したりして、結果として生じるシステムの動作 (症例数、入院数、死亡者数、またはその他の指標に反映されるウイルスの拡散) を表す出力を提供します。 .
パンデミックやその他の病気の発生を理解するために、科学者は定量的疫学的モデリングに対する 2 つの確立されたアプローチに目を向けます。それぞれのアプローチには用途と制限があり、さまざまな種類のデータを使用するさまざまな規模でより適切に機能します。今日、疫学者は通常、さまざまな程度で両方を使用しているため、彼らのモデルは 2 つの間のスペクトルに当てはまります。
スペクトルの一端にあるのは、集団を、感染しやすいか、感染しているか、回復しているか (S、I、または R) に基づいて「コンパートメント」に分割し、微分方程式系を使用して、人々が 1 つのコンパートメントから別のコンパートメントに移動する方法を記述する疾患モデルです。別。 COVID-19 の潜伏期間は非常に長いため (誰かがウイルスに感染してから、他の人に感染させることができるようになるまでに数日かかる可能性があるため)、そのモデルには「露出した」コンパートメント (E) も含める必要があります。これらの SEIR モデルは一般に、集団がかなり均一であり、人々が比較的均等に混ざり合い、誰もが等しくウイルスに感染しやすいと仮定しています。
もちろん、それは実際には真実ではありません。誰かの年齢、職業、病歴、場所、その他の特徴のすべてが、ウイルスの影響と感染の可能性に影響を与える可能性があります。したがって、最も必要最小限の SEIR モデルは、限られた一連の動作しか表すことができません。大学の再開計画のように、より複雑または特殊な状況をモデル化するには、病気の検査や接触者の追跡などのプロセスのマッピング、および学生、教職員のグループ間の相互作用の詳細なパターンが必要です。研究者は、単純な平均から離れなければなりません。 .
それを達成するために、彼らは病気がどのように広がるかにより多くの構造を追加することによって、SEIR モデルを装飾することができます.たとえば、Meyers のグループは、相互接続された SEIR モデルで構成された大規模なモデルを構築しました。これは、米国の 217 の大都市のそれぞれの数十の亜集団内のウイルス感染のダイナミクスを表しています。それらは、それらの都市間の人々の移動も考慮に入れました.
研究者がこれらの詳細なレイヤーを追加するにつれて、疫学的モデリング スペクトルの反対側に移動します。つまり、エージェント ベースのモデルに移行します。これは、人々のグループ全体で平均化するのではなく、相互作用、日常の活動、およびウイルスがどのように感染するかなど、個人をシミュレートするものです。感染した場合、それ自体が影響を与える可能性があります。 (Goldenfeld と Maslov がイリノイ大学のために開発したモデルはエージェントベースでした。) この粒度により、モデルは、最も単純な SEIR モデルでは抽象化されてしまう固有の不均一性とランダム性の一部を捉えることができますが、コストがかかります。より多くのデータを収集し、より多くの仮定を行い、モデルのはるかに高いレベルの不確実性を管理します。その負担のために、研究課題で絶対に必要とされない限り、彼らは通常、そのレベルの詳細を求めません。
この種のモデルは、疾患の再生産数、潜伏期間、無症候性の広がりの程度などのパラメーターを推測することで、疾患について多くのことを明らかにすることができます。しかし、彼らはさらに多くのことができます。 COVID-19の場合、そのようなモデルは、無症候性または軽度の症状を持つ人々は、より明らかに病気の人の約半分の伝染性しかないことを示唆していますが、記録された感染症の約80%の原因です.同様に、彼らは、COVID-19 の誰かにさらされた場合、幼児が感染する可能性が大人の約半分であることを示しましたが、この感受性は 10 歳以上の子供で急速に増加します.
これらの値を利用して、モデルは仮説のポートフォリオを予測することもできます:都市が店舗の封鎖措置を解除し、レストランは解除しない場合、症例数はどうなるでしょうか?学校の再開を可能にするため、または地元の病院システムが圧倒されないようにするために、接触者追跡プログラムはどの程度効果的である必要がありますか?モデルは、より実用的で即時の意思決定支援にも役立ちます。病気の伝染が特定のように見える場合、病院はどのくらいの個人用保護具を購入する必要があり、ワクチンの普及をどのように優先する必要がありますか?
しかし、それらは予測であり、予測ではありません。それらは一晩で変化する可能性のある仮定に左右され、その結果、不確実性に満ちています。
確かに、これらの予測された未来は、依然として信じられないほど有用な洞察につながる可能性があります.たとえば、COVID-19 がどのように広がるかのモデルから、Kucharski と彼のチームは、接触者の追跡だけでは病気を封じ込めることができないことを学びました。追加の措置がそれをサポートする必要があります。他の研究では、流行の範囲を測定するためだけでなく、実際の緩和策として、テストがいかに重要であるかが示されました.ラレモアと他のモデルによるモデルは、感度は低いが高速なテストが、わずかに遅いがより正確なテストよりもはるかに望ましいことを示しました.さらに他のモデリング作業は、病院が必要とする追加のスタッフとベッドの数を決定するのに役立ちました.
それでも、人々が必死に答えを求めていると、予測と予測の区別が簡単にわからなくなります。研究者は、ほぼすべてのパンデミックでそれが発生することを確認しており、今回のパンデミックでも発生することを確認しています — 通常、最初の投影モデラーが公開を決定したときから始まります:最悪のシナリオ.
最悪の反応
3 月中旬、インペリアル カレッジ ロンドンの研究チームが、彼らのエージェント ベースのモデルが、英国では COVID-19 による 50 万人、米国では 220 万人の死者を予測したと発表したとき、それは、社会が文字通り何も対応しなかった場合に発生する可能性のある死亡者数の推定値でした。それは仮説であり、意識的に非現実的な予測であり、何が起こるかの地形をマッピングし始めることができました.それは予言であってはなりませんでした.
では、なぜインペリアル・カレッジはそれを出版したのでしょうか?何らかの介入がどれだけうまく機能しているかを評価するためのベースラインを確立するのに役立ったからです。しかし、それは世界中で行動を促したためでもあります。これは、各国がロックダウンを行い、他の抜本的な対策を検討するのに役立ったモデルの 1 つだったからです。ペンシルバニア州立大学の量的疫学者であるマシュー・フェラーリは、「モデルの有効な使用法であり、警告を発し、州のロックダウンや全国的なマスク義務などの行動を開始することで、その未来が実現するのを妨げる可能性があります。」

しかし、その刺激的な効果には、誤解のリスクが伴います。ジョンズ・ホプキンス大学の疫学者であるジャスティン・レスラーは、パンデミックのシナリオモデルについて専門家以外と話し合うとき、その答えは多くの場合、1 桁以内でしか正しくないことを強調しようとしていると述べています。 「私は常に人々に対して非常に明確です」と彼は言いました。 「それは常に適切な予測として解釈されます。でも、少なくともあなたはそう言ってくれます。」
そのため、英国の死亡率統計がインペリアル カレッジ モデルの数値よりも厳しくないように見えた初春に、この不一致はセンセーショナル主義の告発と国民の不信感につながりました。
オーストラリアのメルボルン大学の数理生物学者で疫学者の James McCaw は次のように述べています。 「それは、シナリオが私たちを怖がらせたため、それを避けるために対応したからです。モデルが間違っているのではなく、私たちが対応したのです。」
この種の誤解は、疫学にとって目新しいものではありません。 2014 年に西アフリカでエボラ出血熱が流行した際、米国 CDC のモデラーは、流行規模の予測の上限を発表しました。彼らは、約 100 万人が死亡した可能性があることを示唆していましたが、最終的な集計では、死亡者は 12,000 人未満でした。これらの見積もりを報告したグループは、アウトブレイクをセンセーショナルに扱ったと思われるため、激しい批判に耐えなければなりませんでした。しかし、批判は、これが最悪のシナリオにすぎず、最悪の現実を未然に防ぐ対応を促すほど人々を怖がらせたという事実を無視していました.
McCaw 氏は、彼のチームと同僚が最悪のシナリオの見積もりを使用してオーストラリアでの COVID-19 に関する独自の状況をモデル化したとき、「そこから得られた非常に恐ろしい数字のいくつか」を見始め、モデルは国境を閉鎖するという国の決定の主要な部分。実際、オーストラリアは早い段階でその呼びかけを行い、厳格な物理的距離の措置を迅速に実施し、人々が重要な活動を行う場合を除いて家を出ないように義務付けました.
後から考えると、オーストラリアはその賢明な選択から大きな恩恵を受けました。この国では、他の多くの国で発生したアウトブレイクよりもはるかに小さく、制御が容易であり、対応に時間がかかりました。台湾、韓国、シンガポール、ニュージーランド、その他の地域、特に SARS や MERS の流行時に学んだ教訓を適用して迅速かつ効果的な対応を行った地域も同様でした。しかし当時、「世界中のさまざまな場所がオーストラリアがそうしたことを批判した」とマッカウ氏は語った.後で、他の場所の荒廃が明らかになったとき、批判のいくつかは消えました.
「『100件の事件のために、500万人の国を封鎖する』と言って、モデルを本当に信頼していない人々になってしまいます。これは一見ばかげているように見えます」と、ニュージーランドの医療部門と学術部門の間の共同作業。 「しかし、それは 100 ケースのためではなく、100,000 ケースを回避するためです。」
彼らが信じたかった物語
残念ながら、予測と予測の混同は最悪のシナリオに限定されず、誤解は世論に限定されませんでした.他のモデリング推定も間違った方法で行われました — そして意思決定権を持つ人々によって。
疫学の遠く離れた分野の研究者によるモデルの過剰な拡散があったことは、おそらく助けにはならなかったでしょう。物理学者、経済学者、統計学者、および複雑なモデリングに関する豊富な経験を持ち、パンデミックを終わらせる手助けをしたいと考えていた人々からのプレプリントの急増です。 . “I think everybody who had a spreadsheet and had heard the words ‘S,’ ‘I’ and ‘R’ felt they should make a model,” Lessler said. “I don’t want to say none of them did a good job, but for the most part, it’s not so much about the math and the technical stuff. It’s more about understanding where you can go wrong in the assumptions.”
Scarpino agreed. “We have somehow managed to do this for every single pandemic and outbreak that ever happens,” he said of well-intended scientists entering the epidemiological modeling arena — and while that can be helpful, it also runs the risk that they might “just reinvent broken wheels.”
One of the first models to capture the ear of the White House was a statistical model published by the University of Washington’s Institute for Health Metrics and Evaluation (IHME). The IHME’s primary expertise is in analyzing the efficacy of health systems and interventions, but the organization wasn’t particularly experienced in epidemiological forecasting or infectious disease modeling as such.
As a result, their model technically qualified as epidemiological, but it didn’t take into account the virus’s mechanism of transmission or other key characteristics of the epidemic. Instead, it fit a curve to mortality data in the U.S. based on several basic premises:that the curve would take the same general shape as it did in China and Italy, where the infection rate was already declining; that people would generally comply with government-level policies and mandates; and that social distancing and other interventions would have the same impact as in China.
A key caveat, though, was that the IHME’s model relied entirely on those assumptions. If any of those conditions changed or weren’t quite right in the first place, the model’s outputs would no longer be relevant.
And many of the model’s assumptions were already not holding. People’s behavior wasn’t coupled to the implemented policies:They got scared and started social distancing long before governors announced stay-at-home orders. But “stay at home” and “social distancing” by U.S. standards also looked nothing like what was being enforced in China. While the epidemic in China followed a simple rise-and-fall progression, the U.S. was hitting a second peak before its first ended, forming a “double S” shape. Unguided by any underlying biological mechanism, the model had no way to account for that changing dynamic. As a result, its estimates fell overwhelmingly short of reality.
“Some of the original forecasts from the IHME group were using a method that had been thoroughly debunked before I probably was even born,” Scarpino said.
That might not have mattered in the long run if the model had been used properly. Typically, epidemiologists use a statistical model like the IHME’s as part of what’s known as an ensemble forecast. (Despite its name, an ensemble forecast is really like a model built from other models, and it too offers only projections, not predictions.) The IHME model’s results would be averaged and weighed mathematically with the outputs of dozens of other epidemiological models, each with its own shortcomings, to achieve the modeling equivalent of the “wisdom of the crowd.” One model in an ensemble might be better at handling unlikely events, another might excel at representing transmission when the caseload is higher, and so on; some models might be statistical, others might be SEIR types that stratify populations in different ways, still others might be agent-based.

“Consensus is not always what you’re after. You don’t want groupthink,” McCaw said. With so much uncertainty in the science and data, “it’s good to have multiple models in different perspectives.”
Comparisons among multiple models can also substitute to a degree for vetting their quality through peer review. “You can’t do peer review fast enough to help in an epidemic,” Goldenfeld said. “So you have to do peer review not sequentially … but in parallel.”
Unfortunately, Lessler said, “it took longer than it should” to get those ensembles up and running in the U.S. The lack of a coordinated national response may have been a root cause of the delay. Scientists were left to their own devices, without the resources they needed to pivot easily from their everyday work to the around-the-clock dedication that COVID-19 ended up requiring. Often, they essentially had to volunteer their time and effort without proper funding and had to establish networks of communications and collaboration as they worked. Much of the infrastructure that could have helped — a pandemic preparedness group in the White House, a centralized top-down organizational effort to connect expert modeling teams with other researchers and officials, and of course core funding — was entirely absent.
Without the ensembles, that left the IHME model, with its single perspective and other problems, as the most appealing strategic resource available to many decision-makers.
“When COVID emerged, the IHME model seemed to come out of nowhere and really got a ton of attention,” Meyers said. “It was being cited by Trump and the White House coronavirus task force, and they had a really nice, visually intuitive webpage that attracted public attention. And so I think it was really one of the most noticed and earliest forecasting models to really put forecasting on the radar in the public imagination.”
Epidemiologists grew alarmed when, in April and May, the IHME projections were used by the White House and others to say that the U.S. had passed the peak of its outbreak, and that case numbers and deaths would continue to decline. Such claims would hold true only if the U.S. stayed under lockdown.
But “people used those models [and others] to reopen their cities and justify relaxing a lot of the stay-at-home orders,” said Ellie Graeden, a researcher at the Georgetown University Center for Global Health Science and Security and the founder of a company that specializes in translating complex analysis into decision-making. “It suggested a degree of optimism that I think assuaged concern early in the event.”
Graeden thinks this made it much harder to get the public and decision-makers to heed more realistic scenarios. “It’s not that IHME was the only model out there,” she said. “It was a model that was showing people the story that they wanted to believe.”
The IHME has since revised its model repeatedly, and other research teams, including Meyers’ group, have used their epidemiological experience to build on some of its core machinery and improve its projections. (Those teams have also developed their own new models from scratch.) The current version of the IHME model is one of many used in an ongoing ensemble forecasting effort run by the CDC. And the IHME has since become more transparent about its assumptions and methods — which has been crucial, given the extent to which uncertainties in those assumptions and methods can propagate through any model.
After all, even the best models are dogged by uncertainties that aren’t always easy to recognize, understand or acknowledge.
Reckoning With Uncertainty
Models that rely on fixed assumptions are not the only ones that need to be navigated with care. Even complex epidemiological models with built-in mechanisms to account for changing conditions deal in uncertainties that must be handled and communicated cautiously.
As the epidemic emerged around her in Spain, Susanna Manrubia, a systems biologist at the Spanish National Center for Biotechnology in Madrid, became increasingly concerned about how the results of various models were being publicized. “Our government was claiming, ‘We’ll be reaching the peak of the propagation by Friday,’ and then ‘No, maybe mid-next week,’” she said. “And they were all systematically wrong, as we would have expected,” because no one was paying attention to the uncertainty in the projections, which caused wild shifts with every update to the data.
“It was clear to us,” Manrubia said, “that this was not something that you could just so carelessly say.” So she set out to characterize the uncertainty rooted in the intrinsically unpredictable system that everyone was trying to model, and to determine how that uncertainty escalated throughout the modeling process.
Manrubia and her team were able to fit their models very well to past data, accurately describing the transmission dynamics of COVID-19 throughout Spain. But when they attempted to predict what would happen next, their estimates diverged considerably, sometimes in entirely contradictory ways.
Manrubia’s group was discovering a depressing reality:The peak of an epidemic could never be estimated until it happened; the same was true for the end of the epidemic. Work in other labs has similarly shown that attempting to predict plateaus in the epidemic curve over the long term is just as fruitless. One study found that researchers shouldn’t even try to estimate a peak or other landmark in a curve until the number of infections is two-thirds of the way there.
“People say, ‘I can reproduce the past; therefore, I can predict the future,’” Manrubia said. But while “these models are very illustrative of the underlying dynamics … they have no predictive power.”
The consequences of the unpredictability of those peaks have been felt. Encouraged by what seemed like downturns in the COVID-19 numbers, many regions, cities and schools reopened too early.
Ferrari and his colleagues at Penn State, for instance, had to confront that possibility when they started making projections in March about what August might look like, to inform their more granular planning models for bringing students back to campus. At the time, it seemed as if the first wave of infections would be past its peak and declining by the summer, so Ferrari and the rest of the modeling team assumed that their focus should be on implementing policies to head off a second wave when the students returned for the fall.
“And then the reality was, as we got closer and closer, all of a sudden we’re in June and we’re in July, and we’re all yelling, ‘Hey, the first wave’s not going to be over,’” Ferrari said. But the reopening plans were already in motion. Students were coming back to a campus where the risk might be much greater than anticipated — which left the team scrambling to find an adequate response.
Chasing the Data
An unfortunate early lesson that COVID-19 drove home to many researchers was that their modeling tools and data resources weren’t always prepared to handle a pandemic on the fly. The biggest limitations on a model’s capabilities often aren’t in its mathematical framework but in the quality of the data it uses. “The best model could not account for our lack of knowledge about epidemiology, about the biology,” Wu said. Only good data can do that.
But gathering data on a pandemic as it happens is a challenge. “It’s just an entirely different ballgame, trying to produce estimates in real time,” Gostic said, “versus doing research in what I would describe as more of a peacetime scenario.”
“It’s a war,” McCaw agreed:one waged against chaos, against inaccuracies, against inconsistencies, against getting completely and utterly overwhelmed. “It’s really hard to get the right information.”
A key number that epidemiological modelers want to know when collecting data, for instance, is the total number of infections. But that’s an unobservable quantity:Some people never visit a doctor, often because they have mild symptoms or none at all. Others want to get tested to confirm infections but can’t because of an unavailability of tests or lack of testing infrastructure. And even among those who do get tested, there are false positives and false negatives to consider. Looking at the number of reported cases is the next best option, but it’s just the tip of the iceberg.
Gathering even that data in a timely way for COVID-19 was often nearly impossible early on. “I grew up in the information age, and so I guess I naively assumed at the start of this pandemic that state departments of public health would have some sort of button, and they could just press that button and data from hospitals around the state would just automatically be routed to some database,” Gostic said. “But it turns out that that button doesn’t exist.”
Scientists who had hoped to immediately start building useful models instead spent most of February and early March just trying to gain access to data. They spent weeks cold-calling and emailing hospitals, departments of public health, other branches of government and consulting companies — anyone they could think of. Researchers had to sort through texts, faxes, case reports in foreign languages and whatever else they could get their hands on, all the while worrying about where that data was coming from and how accurate it was.
It’s been “a real disappointment and a surprise,” said John Drake, an ecologist at the University of Georgia, “that as a country or globally, we’ve done such a poor job collecting data on this epidemic. … I genuinely thought that there would be a government response that would be effective and coordinated, and we haven’t had that.”
“None of us, I think, were prepared for the inconsistent data collection,” he added.
In those early days of the epidemic, case data in the U.S. and other regions was so unreliable and unrepresentative that it often became unusable. Case counts were missing large numbers of asymptomatic and mildly symptomatic infections. Testing and reporting were so scarce and inconsistent that it distorted the numbers that researchers obtained. Pinning those numbers down in real time was further complicated by the lag between when a person got infected and when they showed up in the reported case data. Even the very definition of a “case” of COVID-19 changed over time:At first, an infection was only considered an official case if a person had traveled to Wuhan, exhibited particular symptoms, and then tested positive (the tests were different then, too). But as weeks and then months passed, the criteria kept expanding to reflect new knowledge of the disease.
For some researchers, these problems meant turning to data on hospitalizations and deaths from COVID-19. The recordkeeping for those numbers had its own shortcomings, but in some ways it was more reliable. Yet that data captured still less of the full picture of the pandemic.
“Models aren’t a substitute for data,” Kucharski said.
It wasn’t until late April or May, with the establishment of more comprehensive testing (as well as more reliable pipelines for case data), that some scientists started feeling comfortable using it. Others tried to account for the issues with case data by applying various statistical techniques to translate those numbers into something more representative of reality. As always, there was no right answer, no obvious best path.
Because of these complications, it took months to pin down good estimates for some of the key variables describing COVID-19. During that time, for example, estimates of the proportion of asymptomatic cases jumped from 20% to 50%, then back down to 30%.
Modeling groups also put out diverse estimates of the infection fatality ratio — the number of people who die for every person who gets infected, an important parameter for estimating a potential death toll. Every aspect of the calculation of that figure had huge uncertainties and variability — including that the number itself can change over time, and that it differs based on the demographics of a population.
Unfortunately, the infection fatality ratio is also a number that has been heavily politicized in a way that demonstrates “an abuse of models,” Larremore said. Factions pushing for earlier reopening, for instance, emphasized the lower estimates while disregarding the related epidemiological considerations. “People have their conclusions set a priori, and then there’s a menu of possible models, and they can look at the one that supports their conclusions.”
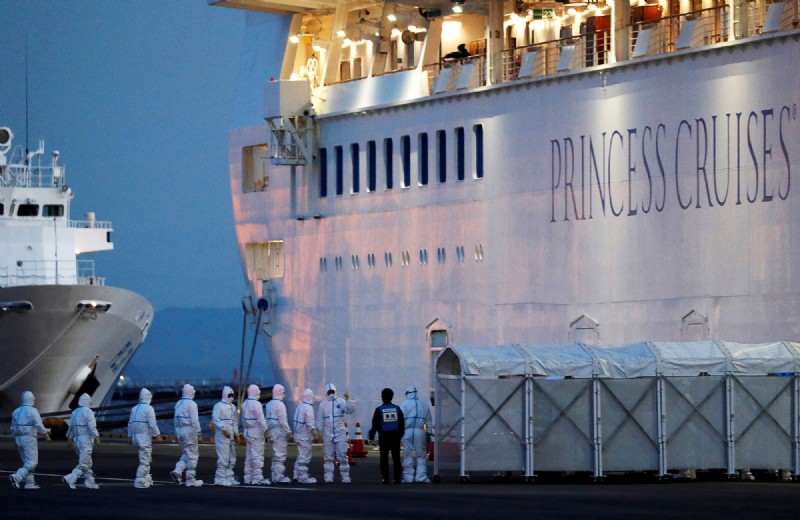
Part of what built researchers’ confidence in the values they were getting was the emergence of special data sets that they could use as something like an experimental control in all the chaos. For example, one of the largest known COVID-19 outbreaks in February outside of China occurred on the Diamond Princess cruise ship, docked in quarantine off the coast of Japan, where more than 700 people were infected. Over time, scientists reconstructed practically a play-by-play of who was infected when and by whom; it was as close to a case study of an outbreak as they were likely to get. The Diamond Princess event, along with similar situations where the surveillance of populations captured the spread of the disease in extraordinary detail, told researchers what they needed to know to reduce the uncertainty in their estimates of the infection fatality ratio. That in turn helped improve their models’ projections of the total number of deaths to expect.
Some of the most comprehensive data came in the summer months and beyond, as testing became more prevalent, and as researchers designed serology studies to test people in a given population for antibodies. Those efforts gave a clearer snapshot of the total number of infections, and of how infection related to other factors.
But these parameters are ever-moving targets. In the U.S., for instance, researchers observed a drop in the infection fatality ratio as hospitals improved their treatments for the disease, and as changing behavior patterns in the population led to a higher proportion of infections among young people, who had a better chance of recovering. Only constant updates with high-quality data can help researchers keep up with these changes.
Obtaining good data on COVID-19 continues to be a problem, however, not just because of shortcomings in the data collection process but because of intrinsic characteristics of the virus that affect the data. Even the reproduction number has proved trickier to estimate than expected:Because COVID-19 mostly spreads through random, infrequent superspreader events, a simple average value for how quickly it’s transmitted isn’t as useful. Moreover, during past epidemics, modelers could estimate changes in the reproduction number over time from data about the onset of symptoms. But since so many COVID-19 infections occur asymptomatically or presymptomatically, symptom onset curves can be misleading. Instead, modelers need curves based on infection data — which for COVID-19 can only be inferred. This messiness makes it difficult to look back and analyze which interventions have worked best against the disease, or to draw other conclusions about apparent correlations.
The Biggest Problem Is Us
But by far, the biggest source of uncertainty in COVID-19 models is not how the virus behaves, but how people do. Getting that X-factor at least somewhat right is crucial, given just how much people’s actions drive disease transmission. But people are capricious and difficult to understand; they don’t always act rationally — and certainly not predictably.
“Modeling humans is really hard,” Graeden said. “Human behavior is idiosyncratic. It’s culture-specific,” with differences that show up not just between nations or demographics but between neighborhoods. Scarpino echoed that idea:“You walk across the street and it’s a different transmission dynamic, almost,” he said.
Ferrari and his colleagues have seen just that at Penn State. Since the fall, they’ve repeatedly conducted antibody tests on both university students and people who live and work near campus. They found that even though the outbreak infected 20%-30% of the 35,000 students, the surrounding community had very little exposure to COVID-19. Despite their proximity, the students and the townsfolk “really did experience completely different epidemic settings,” Ferrari said.
Those differences weren’t limited to behavioral or cultural practices but extended to systemic considerations, like the ability to work from home and access to resources and care. “I think most people, given the opportunity, would exhibit good individual behavior,” Ferrari said. “But many people can’t, because you first need the infrastructure to be able to do so. And I think those are the kinds of insights that we’re slowly moving towards trying to understand.”
A further complication is that past sociological studies of human behavior no longer apply:During a pandemic, people simply aren’t going to behave as they normally do.
“One of the big sort of ‘oh no’ moments,” Meyers said, “was when we realized that everything we’d been assuming about human contact patterns and human mobility patterns was basically thrown out the window when we locked down cities and sheltered in place. We didn’t have the data. We didn’t have the pre-baked models that captured this new reality that we were living in.”
Unfortunately, top-down regulations can’t be used as proxies for people’s actual behaviors. Anonymized data about people’s movements — from cell phones and GPS-based services — has shown that people mostly stopped moving around early in the pandemic, independently of whether lockdowns were in place in their region; people were scared, so they stayed at home. Meanwhile, interventions like mask mandates and bans on indoor dining were instituted but not always enforced, and people gradually moved around and interacted more as the months wore on, even as the number of deaths per day rose to unprecedented heights.
Those kinds of behaviors can significantly complicate the shapes of epidemic curves. But knowledge of those behaviors can also illuminate the deviations between what researchers observed and what they expected. For example, the modeling for the spread of COVID-19 through nursing homes and long-term care facilities didn’t initially match the observed data. Eventually, scientists realized that they also had to take into account the movement of staff members between facilities. But it took time to pinpoint that behavioral factor because such specific movements are usually abstracted away in simpler models.
“Confronting the link between behavior and transmission is difficult,” said Joshua Weitz, a biologist at the Georgia Institute of Technology, “but it has to be prioritized to improve forecasting, scenario evaluation, and ultimately to design campaigns to more effectively mitigate and control spread.”
This realization led researchers to pursue data from cell phones and other sources, to design comprehensive surveys about interactions and other activities outside and within households, and to integrate that information into epidemiological models at a massive scale. “We hadn’t actually really developed the technology to do that [before],” Meyers said, because there had been no urgent call for that data (or no access to it) before COVID-19. A new methodology was needed, along with new ways to assess the quality and representativeness of the data, which was often supplied by private companies not subject to the same scrutiny as other epidemiological data sources. “All of that we’ve developed in the last few months,” she said.
Uncertain Communications
These different types of uncertainty add up and have consequences down the line. Because small uncertainties can have exponentially bigger effects, “it’s a little bit like chaos,” Goldenfeld said. But communicating that uncertainty to decision-makers in a way that’s still useful and effective has proved a particularly difficult task.
“Decision-makers want answers,” Graeden said, but “a model cannot produce an answer. And it shouldn’t. It can get close. It can be suggestive.” To her, the pandemic has only highlighted a long-standing communications challenge. “There’s actually a culture clash here, where fundamentally the communication always will be broken, because the scientist has been trained not to give an answer, and the decision-maker’s only job is to provide one.”
Abbott recalls getting feedback from decision-makers about having too much uncertainty in some of his modeling work. “I’m not sure what the happy balance is,” he said. “You need what actually happens to be encapsulated by your estimates going forward; otherwise people lose confidence. But equally, if you’re too uncertain, people can’t make any decisions off your estimates.” When asked what he’d done since getting the feedback about reducing uncertainty, “I accidentally added more,” he said, a bit sheepishly.
One way researchers and decision-makers have tried to bridge that culture gap is to focus on qualitative narratives that emerge from all the models, rather than specific quantitative outcomes. Just knowing something as simple as whether the epidemic is growing or shrinking at a given time can be immensely helpful, even if different models spit out very different numbers to reflect it. The trend can be used to analyze which interventions have been most effective in various contexts, and to suggest which combinations of interventions might be best to try going forward.
“Trends are more robust than precise numbers, and can be used to plan responses,” Goldenfeld said. “Instead of saying, ‘Can you predict for me how many hospital beds am I going to need?’ what you can predict is, ‘What is the probability in the next, say, three weeks that the hospital capacity in this region is going to be exceeded … and by how much?’”
Relying on multiple models also allows researchers and decision-makers to address a variety of assumptions and approaches to bolster confidence in whatever conclusion they reach. Kucharski explained that if two completely different models both conclude that some level of contact tracing isn’t enough to control an outbreak, “then the difference in structure and the differences in precise estimates are less relevant than the fact that they both come to the same answer about that question.”
Even the uncertainty itself can be informative. In December, officials at Penn State, including Ferrari and his team, initially settled on reopening their campus in mid-January. But as 2020 drew to a close, they decided to push that plan back a month:Students will now be returning to campus on February 15. Because of factors such as the rise in levels of transmission in the surrounding county, there was “a real concern that we just wouldn’t be able to maintain operations at the level that was necessary to bring students back,” Ferrari said.
But the decision was also based on uncertainties in the projections of a model that Ferrari and his colleagues had been looking to for guidance — the CDC’s ensemble forecast, which aggregates the results of dozens of individual models. In December, the bounds on the uncertainties were so wide that “we didn’t really quite know what January was going to look like,” he said.
He and his team also noticed that many of the individual models in the ensemble were under-predicting the number of cases that would arise. “For the three to four weeks before that decision got made, we were seeing in reality worse outcomes than the models were projecting,” Ferrari said. “So that gave us pause and made us think that really, the coming three to four weeks are more likely to be on the pessimistic side of that confidence bound. And we just really couldn’t accept that.”
The trustworthiness of the models isn’t the only consideration in setting policy. According to McCaw, it also helps to have cultivated relationships with government officials and other policy-setters. He and members of his team have spent 15 years doing this in Australia, mostly through discussions about how best to respond to flu epidemics. “We’ve had hundreds and hundreds of meetings now,” he said. “We learn each other’s styles, we learn each other’s quirks, and we have a lot of trust.” Those long-term relationships have helped him figure out how to explain his work in a way that not only makes sense to whoever he’s interacting with, but also allows them to explain it to other policy leaders.
In line with that goal, over the past five years and more, McCaw and his colleagues have conducted workshops and programs to figure out how best to visualize and communicate their modeling. (Tables of numbers work surprisingly well. Though they “can feel a bit overwhelming and busy,” according to McCaw, “they’re a high-dimensional visualization of something, so they’re actually quite powerful.” Heat maps are less successful for anything other than geographical data. Graphs have their uses, but they need to be directed at a particular policy question.) Most importantly, the Australian team learned that “shying away from uncertainty is a disaster,” McCaw said. “So we embraced that.”
Other researchers have gone straight to social media instead, posting their preprints and models on Twitter to inform the public directly and to gain access to academics and government officials through less formal channels.
These forms of communication remain difficult and time-consuming, and many researchers have had to learn about them on the fly as the pandemic progressed. “It’s really made me wish that there were more communication lessons in STEM education,” said Kate Bubar, a graduate student in Larremore’s lab at the University of Colorado, Boulder who started pursuing her doctorate during the COVID-19 crisis.
The exchanges with policy-setters also benefit the scientists by illuminating decision-making processes, which can seem opaque when they go beyond the models’ math to consider other factors.
When case numbers at Penn State shot up after its reopening, Ferrari and others at first urged university officials to close the campus again immediately. But then, he recalls, the head of university housing told him, “Matt, do you understand what ‘shut it all down, send them all home’ means?” He pointed out that the school’s 40,000 students would not suddenly disperse; 30,000 of them would likely stay in the apartments they had rented. Moreover, the logistics of getting everyone off campus were intimidatingly hard and could even worsen the risk of spreading COVID-19.
“And I think each one of us went through cases like that,” Ferrari said, “where we got to the end of a really impassioned discussion and said, ‘OK, you know, I’m going to stand down because now that I can see the case from your perspective, I recognize all of the things that I was glossing over.’”
How Models Can Help Next
Epidemiological models will continue to be crucial in what everyone hopes will be the end stages of the pandemic, particularly as researchers look into the next big questions, such as how to prioritize the dissemination of vaccines. A common way to do so for the flu, for instance, is to target vaccines at children, which indirectly protects the rest of the population because kids are a major node in the network of flu transmission (though they do not seem to be for COVID-19).
Larremore and Bubar have been part of the ongoing effort to model what that should look like for COVID-19. Long before any vaccines were available, they considered an extensive list of uncertainties:about the disease dynamics, about whether a vaccine would block disease transmission, about how long immunity might last, and other factors. A big question was how effective a vaccine needed to be, and in what way that efficacy would manifest:If a vaccine was 50% effective, did that mean it worked perfectly but only in 5 out of 10 people, or that it cut everyone’s chances of infection in half?
They quickly found that in setting COVID-19 vaccination strategies, it’s necessary to choose between the goals of reducing deaths and reducing transmission. If they wanted to minimize mortality, direct vaccination of the elderly was the way to go, regardless of vaccine efficacy and other what-ifs. But if the goal was instead to reduce transmission (in places with large numbers of essential workers who couldn’t stay in lockdown, for instance), then adults between the ages of 20 and 50 should be vaccinated first instead:Their behaviors and interactions made them more of a hub for further spread. In that case, however, there would also be slight differences in allocation based on the efficacy of different vaccines, population demographics and contact patterns. “We got different results for Brazil, Belgium, Zimbabwe and the U.S.,” Larremore said.
Now that multiple vaccines have been approved in various countries around the world, researchers have been able to refine those models. But they’ve also had to expand on their work to account for new events that are shifting priorities again. One is the emergence of new SARS-CoV-2 mutations that have raised the transmission rate in many regions. Another is that the rollout of vaccines is happening much, much more slowly than had been anticipated.

Still, to Larremore, the basic calculus stays the same. “It’s a race,” he said. “It’s racing against the virus itself that’s hopping from person to person.” And so, “as you roll the vaccine out more and more slowly, it’s going to change what strategy you would use.”
In countries where rollout has been very slow compared to viral transmission, the models show that taking the direct approach and reducing mortality — by first vaccinating older people and others who are at higher risk — is the best way to move forward. But “if you’re South Korea, Taiwan, New Zealand” or somewhere else where transmission is under better control, Larremore said, “you have a totally different set of options” because the race against the virus looks so different. He and Bubar showed that similar shifts in strategy could rely on other factors, such as different reproduction numbers and overall transmission rates.
Now, though, the debate over vaccination concerns not just which people to vaccinate but also how and when to do it. The two approved vaccines in the U.S. each require two doses to deliver their full 95% efficacy. But given how slowly those vaccines are being distributed, researchers have begun modeling other scenarios, including giving as many people the first dose of the vaccine as possible, rather than setting aside half of the available doses to absolutely ensure that people who receive their first dose will receive their second on schedule.
That strategy has the advantage of ramping up baseline protection in a population:The first dose confers only about 52% protection, which isn’t satisfactory by the usual vaccine standards but could slow the spread of infections enough to prevent more cases and deaths in the long run. But it’s also gambling on the likelihood that enough second doses will be available when they are needed. People who receive their second dose later than intended may never get the full measure of vaccine immunity, and some researchers worry that widespread delays in producing full immunity could give the virus more opportunities to mutate and “escape” a vaccine’s control.
SEIR models have helped to quantify that gamble. Assuming certain dose efficacies, waning efficacy between doses over time, and other factors, the models have shown that trying to deploy as many first doses as possible can avert around 25% more COVID-19 cases (and sometimes more) over eight weeks than setting aside half of available doses can. In fact, the researchers found that only in the worst-case scenario — if the first dose of the vaccine had a very low efficacy and if the vaccine supply chain collapsed — would setting aside half the doses for the future be the better alternative.
Ferrari points out that this trade-off is nothing new:He’s seen it in his own work on measles and meningitis outbreaks, and in colleagues’ work on cholera, yellow fever, polio and other diseases. The mathematical models are straightforward, he says, and they show that in the midst of an outbreak, the emphasis should always be on quickly vaccinating as many people as possible, even if it means sacrificing some of the efficacy of the vaccination campaign.
Such models have been instrumental in leading the U.K. — and now the U.S. — to adopt that plan. Perhaps they wouldn’t have if the virus hadn’t “just put on rocket boots,” as Larremore put it, or if the vaccine rollouts had happened more efficiently in the first place. But that’s why models have to take into account so many possibilities and uncertainties. (There are other open questions, too, like how long immunity will last, and whether COVID-19 will be a one-time crisis or a seasonal ailment like the flu, which will affect future decisions about how many vaccines to continue buying and how to prioritize them.)
“The math is simple,” Ferrari said. “Where the math meets the real world is where the complications come in.”
Going forward, there are still questions about human behavior to reckon with. Because of disabilities, poverty or other obstacles, some people may not be able to get to a vaccine distribution center, or they may be hesitant about getting a vaccine at all. As vaccines protect those most susceptible to COVID-19, “we’ll see mortality drop — along with the coming of spring and the opening of more of the outdoors to people,” Larremore said. “I think we’re going to see a lot of pressure put on officials to really reopen things.” People will start to act differently regardless. Will they get less careful or take more risks after getting a first dose or a second, or after seeing more and more people receiving vaccines? How will that affect transmission and subsequent vaccination and intervention strategies?
As with so many decisions that have characterized the COVID-19 pandemic, it’s still true that, while one strategy might have a bigger impact for all of society, it might not be beneficial to certain individuals — say, those who could get a significantly delayed second dose. It places at odds “the perspectives of the medical doctor who sees the patient in front of her,” Larremore said, “and the public health modeler who sees how things are shifting at a very broad scale.”
That’s something that all modelers have encountered. “I can type in these numbers, or see the results saying this number of people might die if [these are] the groups that we choose to vaccinate,” Bubar said. “Just looking at it as a coding simulation, it feels very impersonal. But then we turn on the news and we see the number of actual people that have died every day, and it’s obviously very personal and very shocking.”
That’s why she and Larremore have also tried to incorporate questions about fairness and ethics into their vaccine prioritization models, including a strategy of combining vaccine rollout measures with antibody test results, particularly in areas hit hardest by the virus.
Meanwhile, the pandemic has stolen attention from other health issues, for instance through disruptions of major health care services — including, in many countries, vaccination programs for other diseases. Ferrari has been analyzing how these disruptions will affect measles outbreaks around the world over the next couple of years. Some of his work has already helped to prompt Ethiopia to move ahead with planned measles vaccination programs and other health care services; he’s currently doing more modeling work to determine when and how other regions should resume those practices.
Looking Forward, Looking Back
Researchers expect to be dissecting what happened during the COVID-19 pandemic for years to come. They will comb through the massive numbers of models that were generated and try to account for what worked, what didn’t and why. But there are key lessons they are already taking away from the experience in preparation for the inevitable next pandemic.
One is that they should take advantage of new, potentially rich streams of data from cell phones and other sources, which can provide detailed information about people’s real behaviors. Another is that certain kinds of problems are most easily conquered by dividing them up among teams, sometimes spanning several disciplines.
To make that possible, Manrubia and other researchers have called for national and worldwide programs dedicated to epidemiological forecasting and pandemic science. “We need to undertake a global program, similar to those meteorological institutes that you have in all countries,” Manrubia said. “This is something that doesn’t exist at the epidemiological level. And we need that, at the world scale.”
Such a program might guide the development of extensive systems for data collection and sharing, as well as infrastructure for rapid testing, contact tracing and vaccine production. It could frame more coherent strategies for when and how to use certain types of models for optimal results. It could also establish networks for helping experts in diverse fields to connect, and it could offer protocols for integrating their areas of expertise into informed decision-making processes. The COVID-19 pandemic has broken ground for building those capabilities.
But the other crucial lesson of COVID-19 has been that epidemiologists need to communicate the proper uses and limitations of their models more effectively to decision-makers and the public — along with an appreciation of what the uncertainties in those models mean. The frustrating challenge is that researchers are often already offering these explanations, but the public and its representatives tend to want more certainty than science can provide. And when governments decide to disregard researchers’ best counsel and clutch instead at specious but popular policies, it isn’t clear what scientists can do about it.
Drake says he had hoped that U.S. policy leaders understood how measures like lockdowns could create time to formulate a national response to the pandemic. “I thought we did the right thing by locking down. And then we squandered [it]. We bought ourselves a month,” he said. “But we didn’t do anything with that time.”
Jewell is also outraged at what he called the “shambolic” U.S. response. “There really should be a national strategy:If you’re in an area with this level of community transmission, this is what your schools could do,” he said. Instead, “there is no plan. There is no strategy. Everyone — every campus and every school system — is on their own.”
He points accusingly at “the shocking performance of the CDC.” He doesn’t blame individual researchers there, but “somehow, politically, the CDC has been completely compromised,” he said. “We always used to turn to the CDC:‘Give us advice! What do we do?’ They were getting the best quality data.” But during this pandemic, that hasn’t happened. “They’ve given terrible advice.”
Drake recognizes that “it’s a policy decision, not a scientific one, as to what tradeoff you’re willing to accept in terms of the cost to the country and the number of lives lost — how many deaths could have been averted, what are we willing to pay for those.”
“But from my vantage point,” he continued, “much of the death and illness that we’ve seen in fact could have been prevented.” The models can warn us about fatalities to come, but we have to be willing to learn how to listen to them.